When diagnosing Mass Air Flow (MAF) sensor issues, technicians often compare the vehicle's wiring diagram specifications against live sensor data readings. The question of "which tells the truth" arises when these sources conflict. Understanding the distinct roles of each is crucial.
The Wiring Diagram: Intended Design & Specification
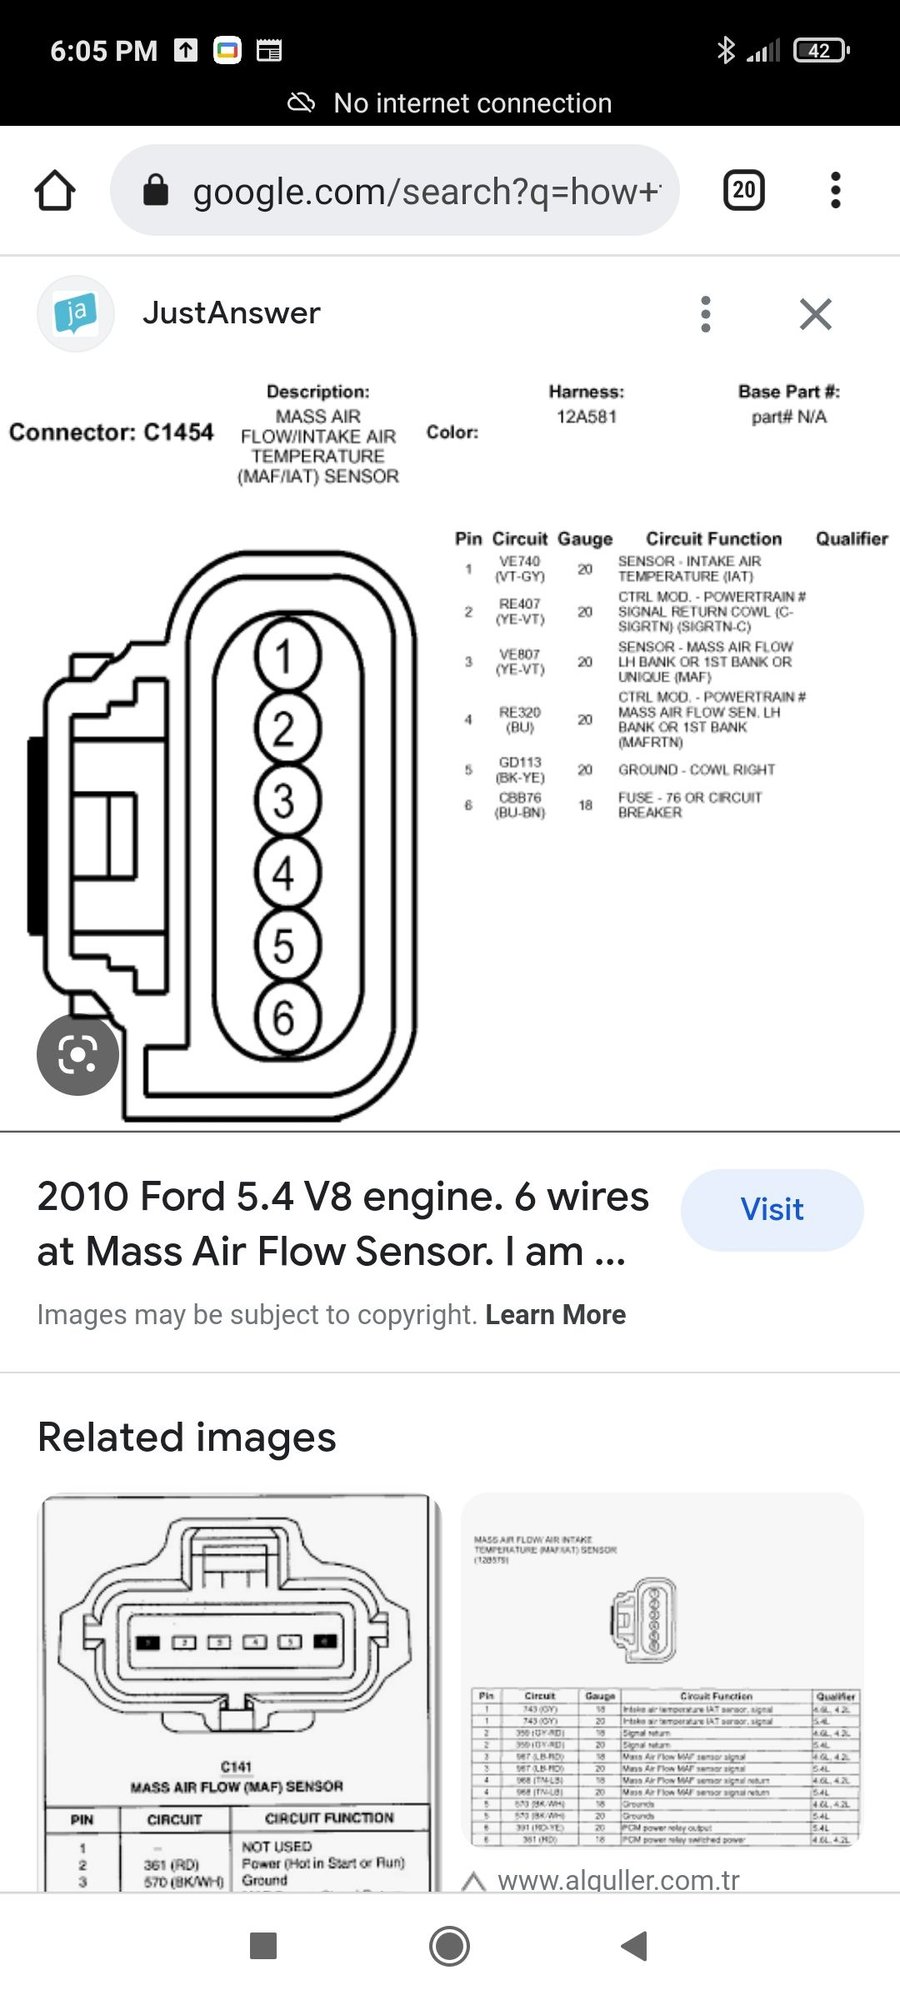
The MAF wiring diagram provides the design specification and intended circuit operation. It shows:
- Power & Ground Circuits: Required reference voltage supply (typically 5V or 12V) and designated ground points.
- Signal Path: The designated path the MAF signal takes to the Powertrain Control Module (PCM), including pin numbers and connector identities.
- Component Relationships: Connections to fuses, relays, other sensors, or shared circuits.
- Wire Colors & Gauges: Essential for physical circuit tracing.
Its "truth" is the factory-engineered standard. It tells you how the circuit should function electrically and physically when correctly assembled and intact.
The Sensor Reading: Actual Circuit & Component Status
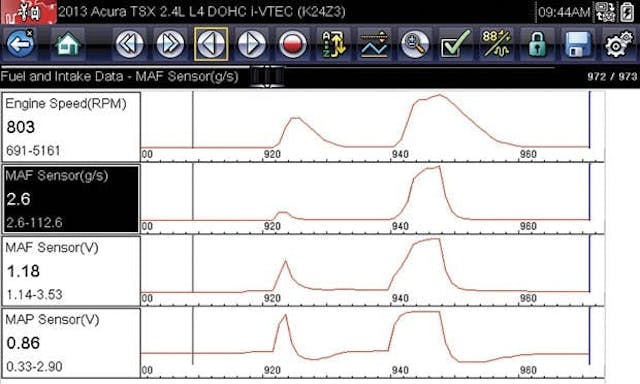
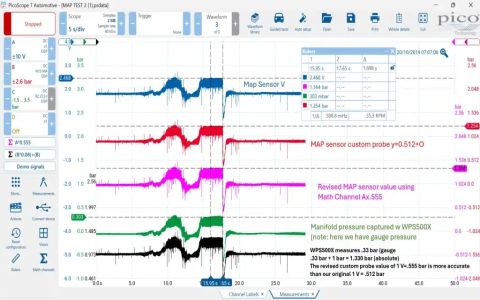
Live MAF sensor readings, obtained via scan tool PID data or multimeter/oscilloscope measurements, show the actual, real-time electrical behavior within the circuit:
- Signal Voltage/Hz Output: The value the sensor is currently producing based on airflow and its own condition.
- Presence/Absence of Reference Voltage: Confirms if power is actually reaching the sensor connector.
- Ground Circuit Integrity: Measured voltage drop indicates if the ground path is intact and low-resistance.
- Dynamic Response: How the signal changes with engine load (rapid throttle snaps).
Its "truth" is the state of the circuit and components under current conditions, faults included.
Conflict Resolution: Diagnostics When They Disagree
A disagreement signals a fault. Here's how to interpret discrepancies:
- Power Missing: Diagram specifies 5V at pin X, multimeter reads 0V? Truth lies with the reading indicating an open circuit, blown fuse, PCM driver fault, or wiring break upstream of the measurement point. Use the diagram to trace the circuit.
- Grounded Signal: Scan tool shows 0V MAF signal regardless of airflow? Diagram confirms signal wire path. The reading reveals a short to ground along that path or an internal sensor failure. Voltage testing isolates it.
- Implausible/Stuck Signal: MAF PID output doesn't change appropriately with engine load? Diagram shows correct signal path to PCM. The reading indicates a sensor fault (contaminated element, internal electronics) or occasionally a PCM input fault.
- Voltage Drop on Ground: Diagram shows ground connection point. Measuring excessive voltage drop between MAF ground terminal and battery negative reveals high resistance (corrosion, loose connection) in that path.
The sensor reading reflects the harsh reality of the physical circuit. The wiring diagram provides the roadmap for understanding where to look for the failure.
Conclusion: Complementary Truths
Neither inherently "lies." A wiring diagram provides the correct benchmark. The live reading tells you how the circuit actually performs against that benchmark. Conflict arises due to physical faults (opens, shorts, corrosion, component failures) or measurement errors. Effective diagnosis uses the diagram to interpret sensor readings and guide precise physical circuit testing (voltage, continuity, resistance, signal waveform) to find the root cause. Trust the reading, but use the diagram to understand what it means.